Diversity in the Costs Lawyer profession in 2020
The data on Costs Lawyers in this report was collected in a survey carried out in November and December 2020 alongside the annual practising certificate renewal process. We collect diversity data from practitioners on a voluntary basis.
Surveys were carried out every three years by the CLSB up to 2019. The data in this report is not directly comparable to that collected in previous surveys. However, to give context to the data, we have drawn broad comparisons to diversity data for other groups alongside our key findings for each of the diversity categories.
We are grateful to the Solicitors Regulation Authority (SRA) for assistance with some of the comparisons used in this report – all of the SRA’s data used was collected in summer 2019 and published in March 2020, and can be found in its publication How diverse is the legal profession?
Further notes on the data and comparisons, as well as the next steps we will be taking to promote a diverse Costs Lawyer profession, can be found below.
Diversity categories
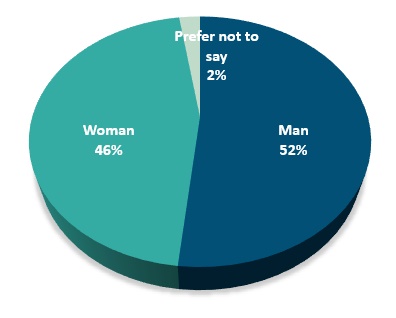
Women make up 46% of Costs Lawyers. 47% of the UK workforce are women. The SRA reported that women make up 49% of lawyers working in law firms.
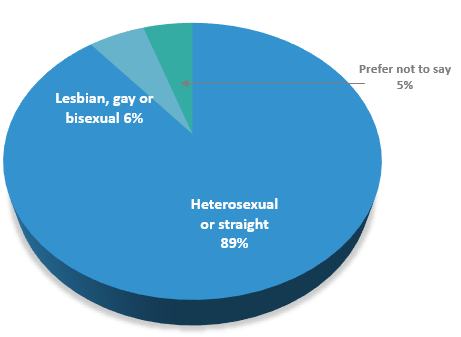
A larger proportion of Costs Lawyers identify as lesbian, gay or bisexual (LGB) compared to 2.7% of the UK population (in 2019). The SRA reports that 3% of lawyers in law firms identify as LGB.
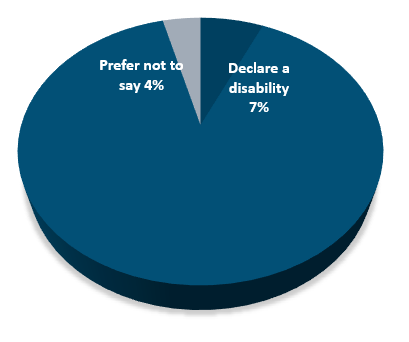
The proportion of Costs Lawyers who say they have a disability (7%) is lower than the UK population where 20% of the working age population, and 10% of employed people in the same age group, declare a disability. The SRA reports that 3% of lawyers working in law firms are disabled.
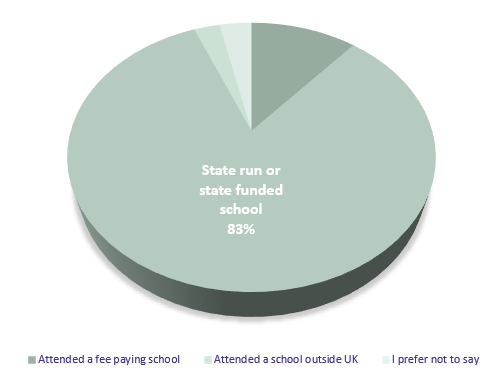
11% of Costs Lawyers attended a fee paying school (6% with a bursary and 5% without). This is higher than the UK population where 7% attended fee paying schools (2% with a bursary and 5% without). The SRA reports that 21% of lawyers working in law firms attended fee paying schools.
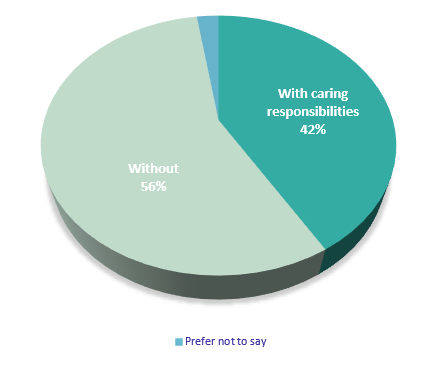
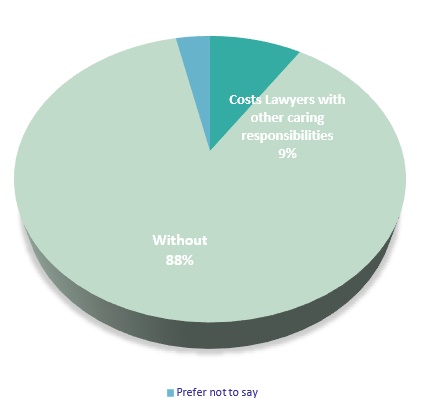
Slightly less than half (42%) of Costs Lawyers have primary caring responsibilities for children. The SRA reports that 34% of lawyers working in law firms have primary caring responsibilities for children.
Notes, next steps and references
43.5% of Costs Lawyers completed the survey used to collect the data presented here. Surveys were undertaken by the CLSB every three years up to 2019. The data in this report is not directly comparable to that collected in previous surveys.
The latest survey did include a question on gender identity, but the percentage of “prefer not to say” answers compared to the percentage of respondents who we might expect to answer “no” to the question (is your gender identity the same as that which you were assigned at birth?) means the data is unreliable.
The SRA’s data, collected in summer 2019 and published in March 2020, can be found in its publication How diverse is the legal profession? The SRA uses statistical modelling to give a better estimate of diversity in the survey population. This improves the quality of the data and “fills in the gaps” to estimate what the results would be if it had a complete response or nobody had said “I prefer not to say”.
This, along with other factors such as a higher response rate, means the SRA’s data is likely to be of better quality – that is, more representative of the total target population – than that collected by the CLSB. However, we believe the broad comparisons we have presented in this report remain valid in providing useful context.
Our diversity and inclusion work programme going forwards can be grouped into three broad categories:
A) Improving our data collection
We believe that the data the CLSB now holds is of a better quality than previously collected. There are, however, further improvements that can be made; improving the response rate and decreasing the proportion of those who “prefer not to say” is one obvious area of work for us.
We will also work to collect better data in future surveys on the interaction between characteristics, opportunities, progression and pay or earnings.
B) Better engagement with our regulated community
One of the advantages of small regulators, with a relatively small regulated community, is that we may be well placed to reach and involve those Costs Lawyers who have an interest, expertise, or valuable experience to contribute and share with us. Making the most of this advantage is a key priority for us over the next year in diversity and inclusion activities and also in other areas of our work.
C) Assessing the likely effectiveness of regulatory interventions to improve diversity and inclusion
Collecting good data is, of course, a necessary starting point but we now need to use this data to evaluate what action we might take to improve diversity and inclusion in the profession. In doing so, we intend to be particularly mindful of the need to have a clear expectation that any intervention will bring about benefits, and we will draw on experience in other sectors and of other legal regulators where possible.
Gender – 47% of the UK workforce are women
ONS, Employment in the UK: December 2019
Estimates of employment, unemployment and economic inactivity for the UK
Sexual orientation – 2.7% the UK population in 2019 identified as lesbian, gay or bisexual
ONS, Sexual orientation, UK, 2019: May 2021
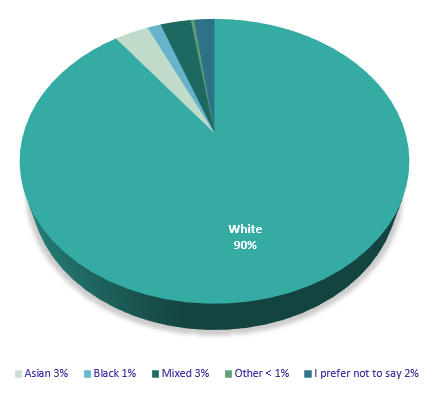
Ethnicity – 13% of the workforce in England, Scotland and Wales in 2019 identified as black, Asian and minority ethnic
UK Government, ethnicity facts and figures, January 2021
Disability – 20% of the working age population and 10% of employed people declare a disability
House of Commons Library, Disabled people in employment, April 2021
Social mobility – 7% of the UK population attended fee paying schools (2% with a bursary and 5% without)
ISC Annual Census, May 2021
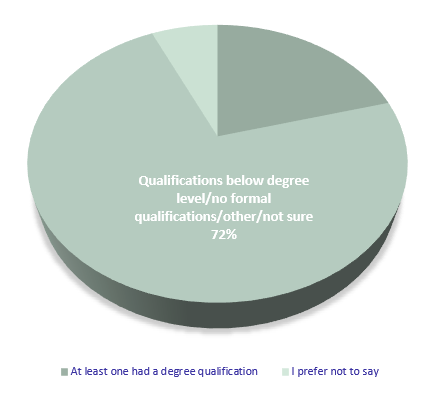
Social mobility – 19% of the UK population (in 2017) had parents with a degree level education
Social mobility commission, Elitist Britain, 2019
This report is also available as a printable PDF.
